Grafana
This section describes the Qlustar Grafana setup. Grafana in combination with Prometheus is used to monitor the hardware and system health of the cluster.
Qlustar Grafana Setup
Grafana is a web-based application and is accessible on the Qlustar head-node at the URL
https://<headnode>:3000 (<headnode> is the hostname of the head-node). You will be asked
for authentification with a user and password. During the installation of the cluster you had
to enter a password for the main admin user admin which you should use to login.
The Qlustar Grafana installation entails a few customizations to optimize user experience:
- SSL support
-
A self-signed SSL certifate is used and created during the installation. Hence your web browser will ask you to allow a security exception for accessing the Grafana web interface, as it cannot verify the certificate authority. You should permanently accept this.
- Database
-
The Grafana configuration settings for dashboards and other settings manageable via the web interface are stored in a mariaDB database rather than the default sqlite DB.
- LDAP Integration
-
On Qlustar installations with a configured local LDAP setup (default for HPC and Kubernetes clusters), Grafana uses the Qlustar cluster LDAP directory for authentification. This means that any cluster user may automatically login to the Grafana web interface with her/his normal cluster user account and password.
- Provisioned configuration settings
-
Qlustar uses the Grafana-provided provisioning method to pre-configure the default datasource and to automatically add the Qlustar-provided dashboards. Within the Grafana web-interface, this datasource and these dashboards are therefore not modifyable.
- Data Source
-
The head-node prometheus server is configured as the sole data source for the installation. Additional custom data sources may of course be added without restrictions.
Assignment of Grafana roles
Grafana has three different roles that can be assigned to users: Admin, Editor and Viewer. The Admin role has an additional feature grafana_admin which when enabled makes the corresponding user a Server Admin.
Qlustar clusters with a configured local LDAP setup provide three corresponding LDAP groups to control the assignment of users to one of these roles: grafana-server-admins, grafana-admins and grafana-editors. If a user is assigned to one of these groups, she/he automatically acquires the corresponding Grafana role when accessing Grafana the next time.
Grafana dashboards
 A number of ready-to-use Grafana dashboards are available on a Qlustar installation. The ones
that are auto-activated depend on the type of cluster nodes and components running on the cluster.
A number of ready-to-use Grafana dashboards are available on a Qlustar installation. The ones
that are auto-activated depend on the type of cluster nodes and components running on the cluster.
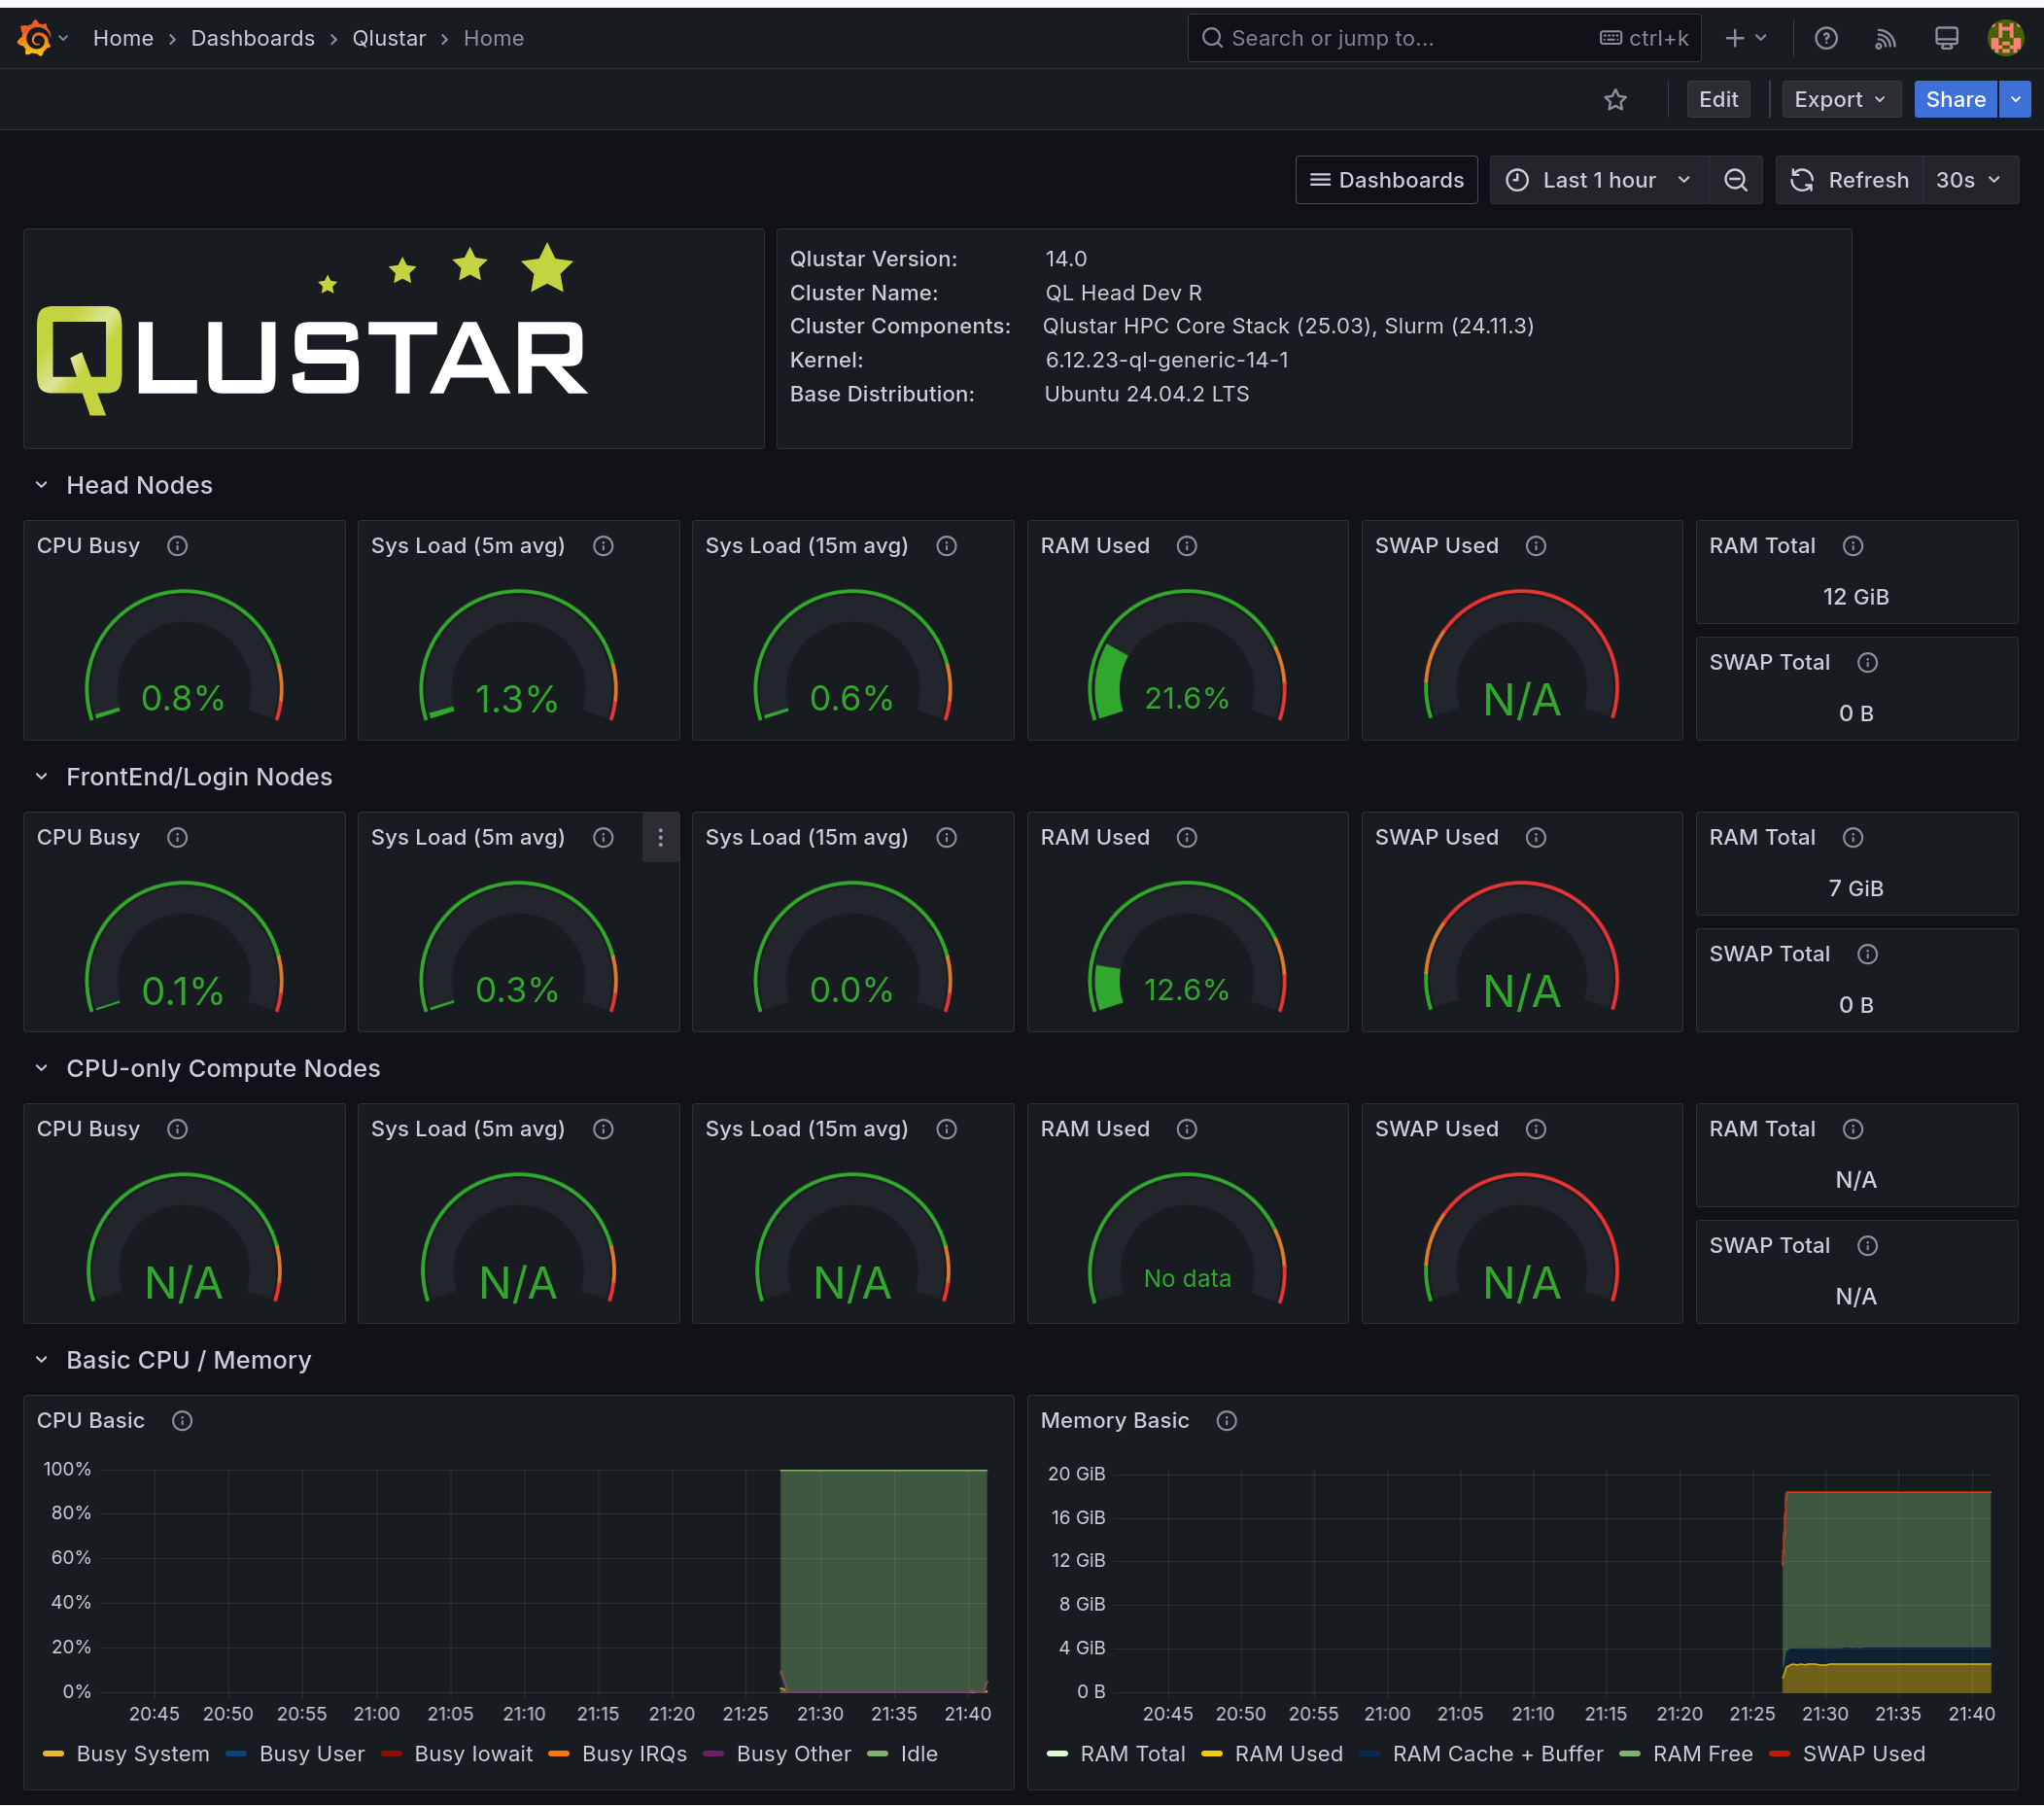
When accessing the Grafana web interface you will automatically be pointed to the Qlustar Home dashboard. It shows summary statistics/graphs of the whole cluster and also separately for the different type of nodes present in the cluster.
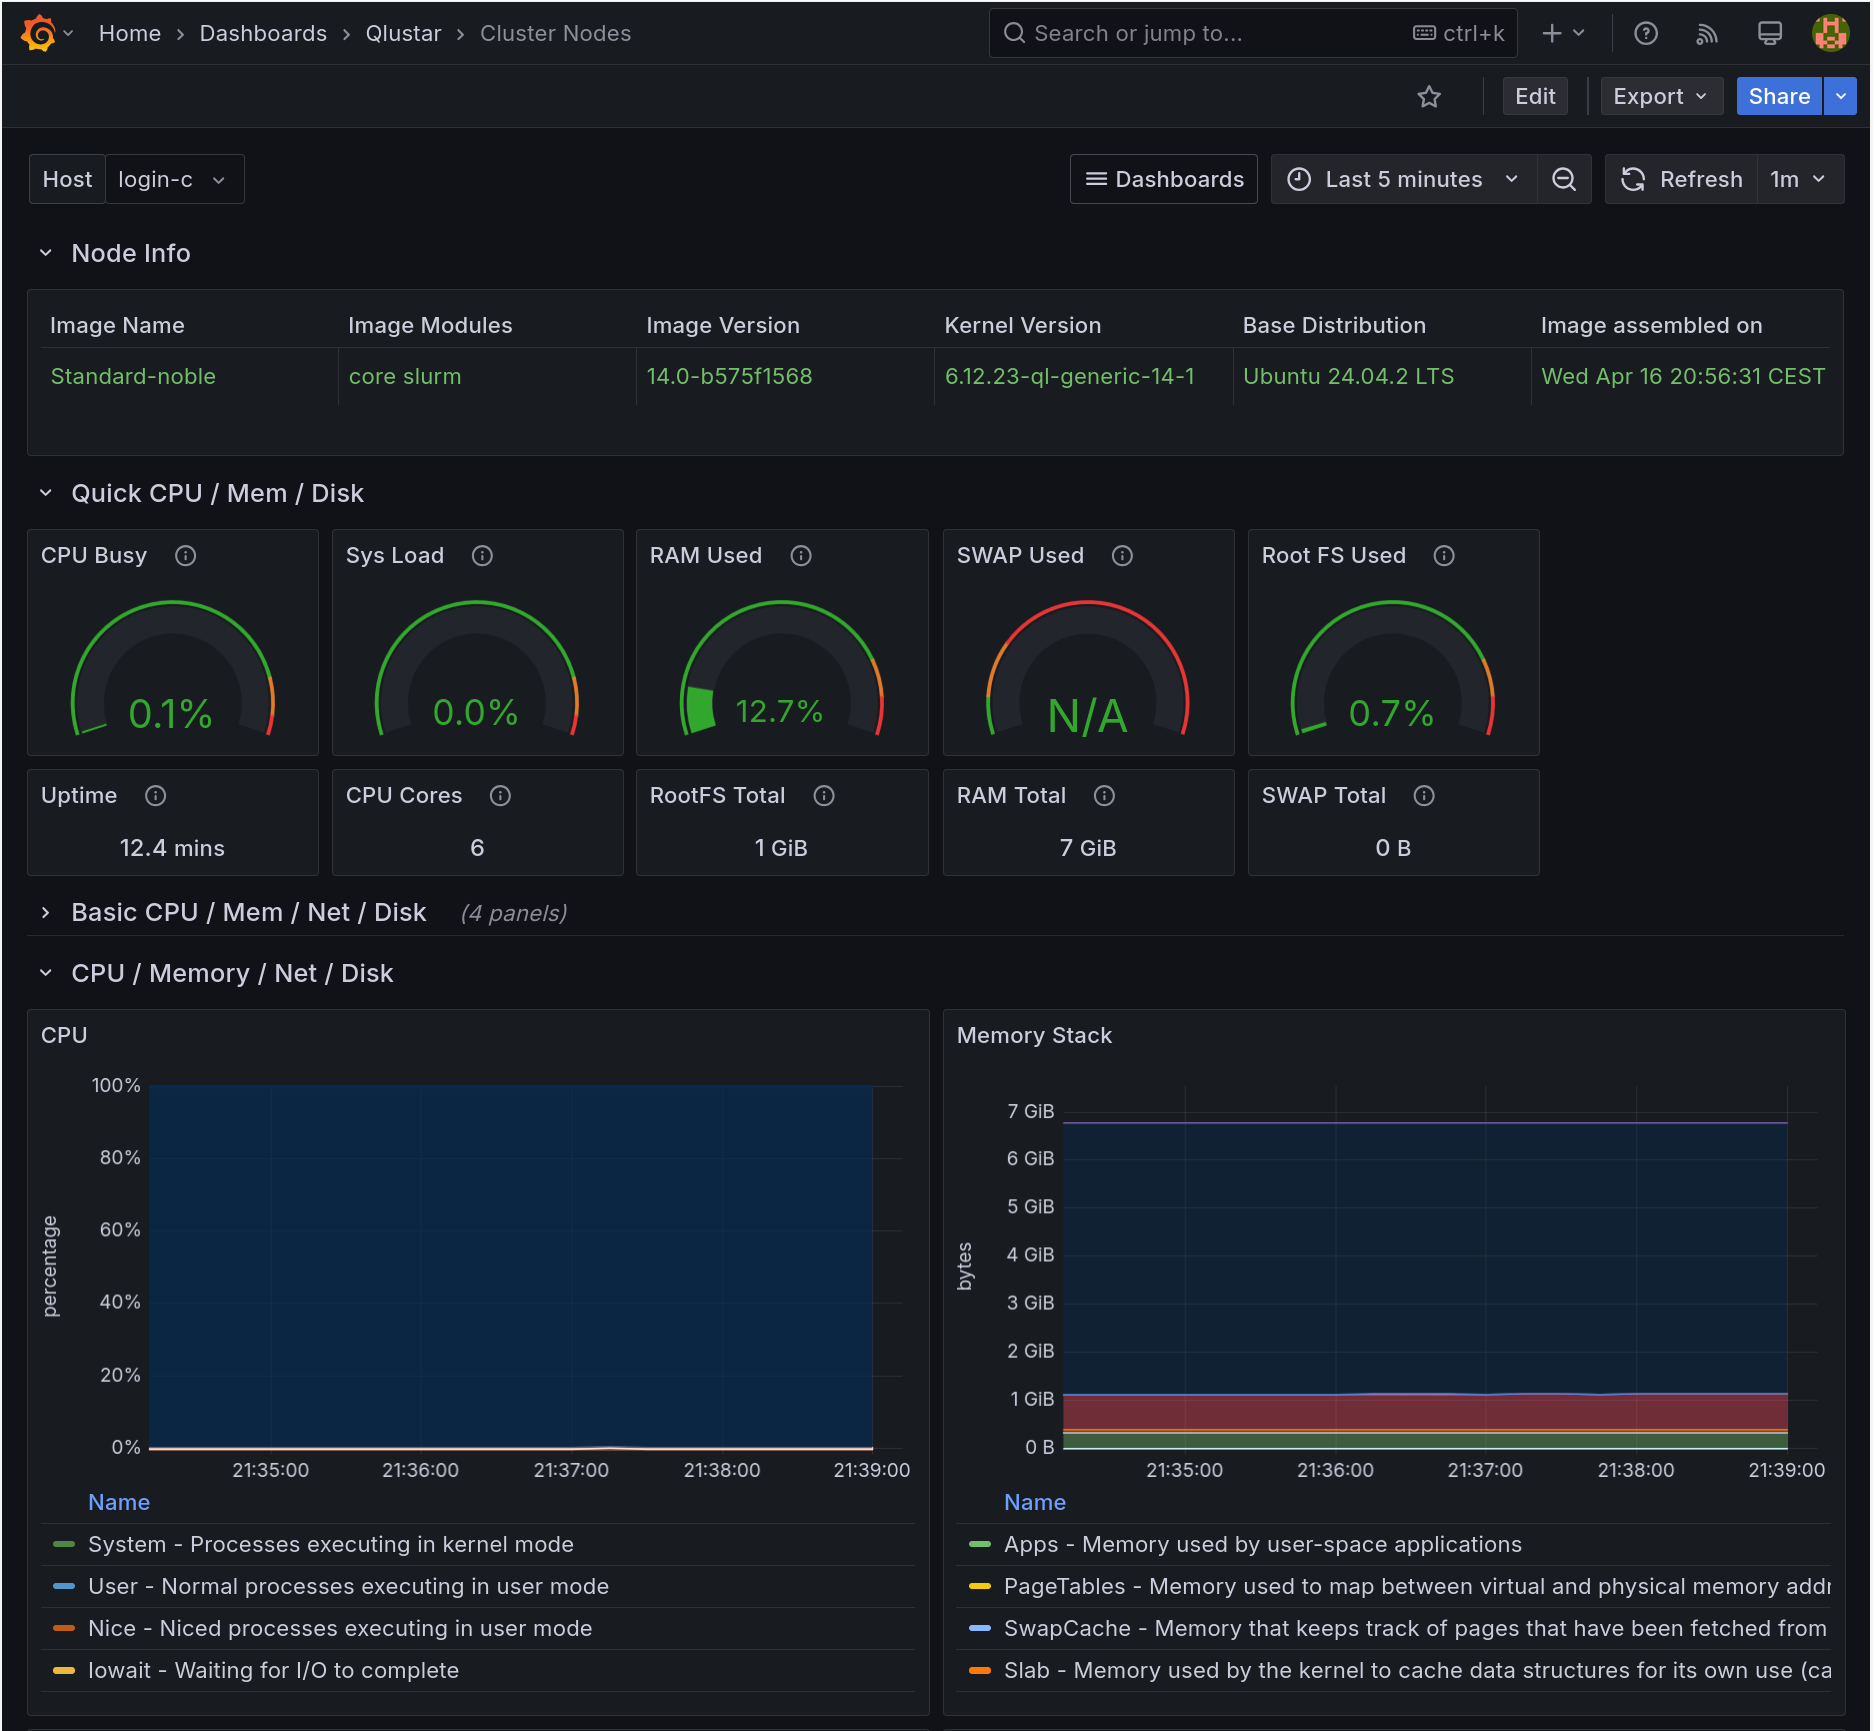 The Cluster Nodes dashboard allows to select one of the nodes in the cluster and shows
detailed information (gathered by the Prometheus node exporter) about that particular
node.
The Cluster Nodes dashboard allows to select one of the nodes in the cluster and shows
detailed information (gathered by the Prometheus node exporter) about that particular
node.
Additional dashboards are provided to visualize the gathered data from Slurm or Kubernetes in case those components are active on the cluster.