Log Viewer
Purpose
QluMan comes with a Log Viewer that allows to inspect important events in the
cluster. Messages are categorized depending on the type of event, when it occurred, which
component(s) it involved and how important it was.
Messages indicator button
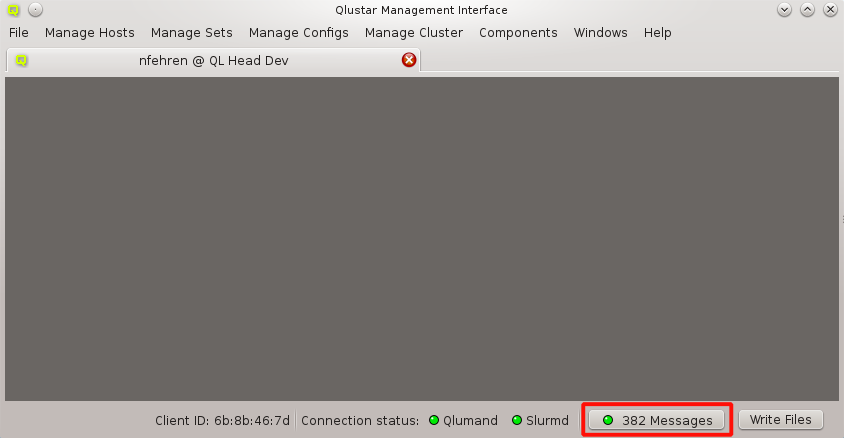
At the right bottom of the main window the QluMan GUI displays a Messages indicator. The button shows the highest priority of uninspected messages, as well as their number. Clicking the button opens the Messages window. The Messages window can also be opened through the menu item.
|
As time goes on, the number of saved messages rises, using up more and more space in the database. More serious, all the messages are transmitted to the GUI client when connecting. Having more than 1000 messages starts to introduce a noticeable delay. More than about 30000 saved messages can become really problematic, causing timeouts on connect. It is therefore recommended to review and clear messages from time to time. Be aware, that deleting several 1000 messages will take quite some time. |
Log Viewer window
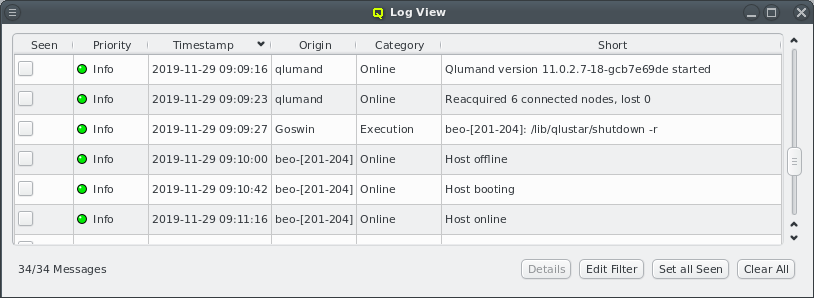
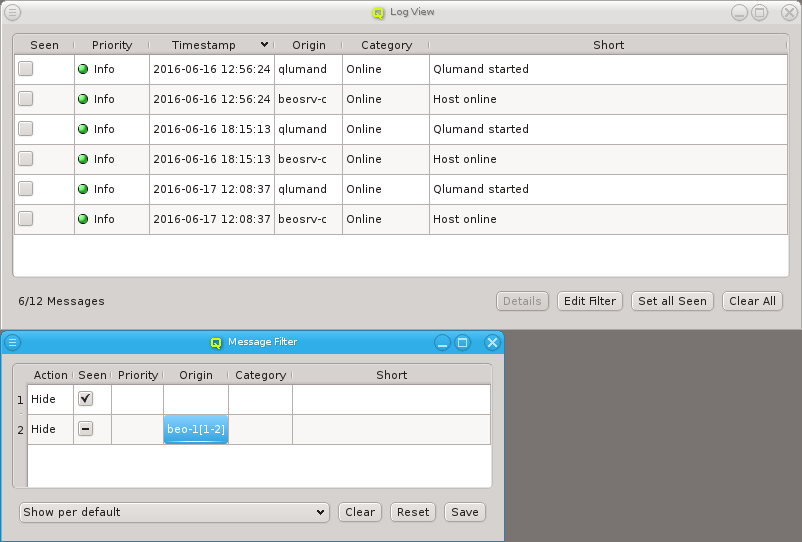
Opening the Messages window shows a list of messages sorted by time, the oldest message displayed at the top. The messages can be sorted ascending and descending by clicking on any of the column headers. Only the short text of each message is shown to keep the window compact. Hovering over a row will show the long text for that row as a tool-tip. The long text can also be seen in a separate window by clicking the Details button. The extra window makes it easier to read multi-line messages and allows copy+paste.
Starting with Qluman 11.0.2.8, a number of improvements have been implemented concerning cluster logging:
-
New message categories were added to better track state changes of the cluster. Creating, cloning or removing a chroot now adds a message in the
Chroot category. On clusters running slurm, starting, stopping or restarting slurmd on a node will now also add a message. -
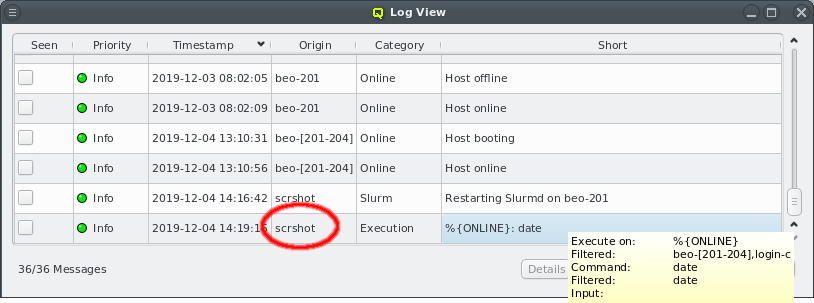
RXEngine command executions are now also logged. For such messages, the origin is the name of the user executing the command. The short message contains the hosts the command was executed on as either a hostlist or a filter followed by the command. For predefined commands, the alias of the command is shown instead of the actual command. The actual list of hosts the command was executed on, as well as the full command text, can be seen in the tool-tip or by clicking the Details button.
-
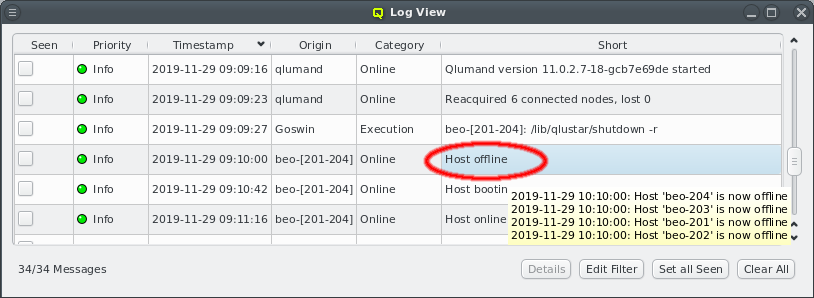
To enhance compactness of the Log Viewer, messages of category
Onlinehave been dramatically reduced in number. For example when restarting Qlumand, the messages originating from individual hosts when reconnecting have been suppressed. Instead, after a short time, a single message is now added showing a summary of all nodes that have reconnected or failed to do so within a given time interval. The full list of nodes can then be seen in the tool-tip or by clicking the Details button.Similarly, when the whole cluster is started up or nodes are rebooted, individual messages are now replaced by summaries as shown in the screenshot. Instead of adding one message per node going offline or coming online, such events when occuring within a short time interval, are now merged into a single entry. The origin for the merged message shows the hostlist of nodes in compact form, while the tool-tip or Details view displays a list with individual timestamps per host.
A new message type, Host booting was added to the
Online category. This message is generated when a node requests its QluMan configuration settings in the pre-systemd phase of the boot process right after its OS image has been downloaded and unpacked. As with the other messages in this category, messages from individual nodes are merged into summary entries.The timestamp displayed for merged messages is the one of the last individual node message of the entry. This means that it is possible for messages to appear out of order. For example the
Host onlinemessage for hosts can appear before theHost bootingmessage if the last node inHost bootinghasn’t come online (yet). If in doubt, compare the individual timestamps for each host.
Message Filter
Not every message is of interest to a user, especially messages that have already been seen. Therefore, each user can create his own filter for messages by clicking on the Edit Filter button. A filter consist of a number of matches shown as rows, with an action, as well as a default action. The filtering process goes through the rows one by one. If all fields set in a row match a message, then the action set for that row is executed: Either the message will be hidden or included in the messages window. If none of the rows match a message, the default action applies to it.
There is one message filter per cluster connection tab. It can be freely edited. The message filter remains in effect till the tab for the cluster is closed. The filter can also be saved as a user-specific setting, so it is reloaded the next time a connection to the cluster is opened again. Alternatively, the filter can be reset to the last saved config or cleared so that the viewer starts without any filtering.
Default Action
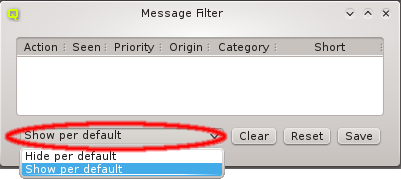
A filter can be constructed as a positive or negative filter. This means it can hide all messages that are not specifically matched or show all messages that are not specifically chosen as hidden. The default action can be chosen at the bottom left corner of the message filter window.
Adding a Filter

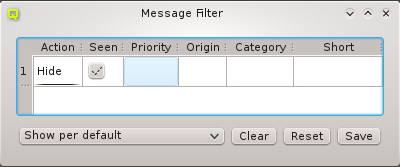
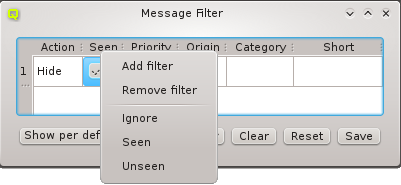
A new filter row can be added by selecting Add filter from the context menu. The new filter has an action of hide and ignores all fields. It therefore hides all messages. To be useful, at least one column should be changed through the context menu, to match only some messages. The context menu in each column contains the possible values the filter can match against in that column. The Origin and Short columns can also be edited freely by double clicking them. The action for the row can be changed between Hide and Show.
Filtering Seen Messages
The most common filter is to hide messages with the Seen flag. It is recommended, to always
start a new filter by adding a row with action Hide and the seen column set to Seen. If
none of the filter rows match against the Seen flag, then it will have no effect in the
Messages window. The Seen filter can also be toggled between Seen and Unseen by
clicking the checkmark. The column can only be disabled by selecting Ignore from the context
menu.
Filtering by Priority
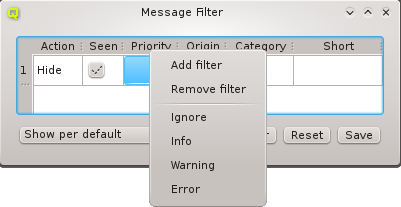
Messages can be purely informational, warnings or errors. Informational messages include information about nodes coming online or the server being restarted. There are usually a lot of informational messages and they can be safely ignored. On the other hand, warnings and errors should be inspected more carefully. In the Log Viewer, the priority of a message is color-coded for quicker visual recognition. Informational messages are green, warnings yellow and errors red. The highest priority of any shown message is also shown in the Messages button in the lower right corner of the main window. This indicates at a single glance, if anything important happened recently.
Filtering by Origin
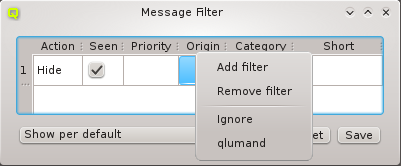
The origin of a message shows the node or service that generated the message. When configuring the filter, the origin can also be expressed as a hostlist to match multiple hosts.
Filtering by Category
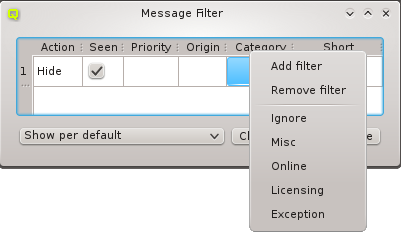
Messages fall into different categories, pooling similar messages for easier filtering. Generally information is categorized under Misc, while messages about nodes becoming online or going offline under category Online. The Licensing category includes all messages concerning changes in the license status. This could be something simple as a reminder that the license key expires soon. Or more important, a warning or error, that the cluster, as currently configured, exceeds the available license count. The last category is Exception. It usually signals a software error, that should be reported.
Filtering by Short text
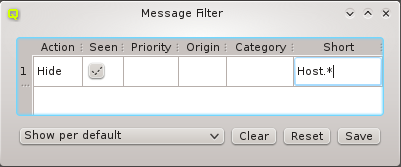
Messages may also be filtered by their short description. Like Origin, this column can be edited by double clicking. Short descriptions are matched using standard regular expressions. To match only part of a short description, prefix and/or suffix the text by ".*" to match any remaining characters.
A Filtering Example
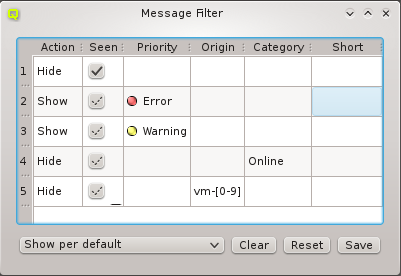
The example filter shows a more involved setup: It contains five rows showing how rows can be combined to achieve the desired filtering result. The default action for this filter is set to show messages. Hence, only messages that are explicitly filtered as not wanted will be hidden.
Row 1 excludes messages with the seen flag set. Rows number 2 and 3 might look odd at first, because their action is the same as the default action: Show. But these two rows prevent any of the later rows from hiding messages with priority error or warning. In other words, warnings and errors will always be shown, no matter what additional filter rows follow. Row number 4 hides messages in the category online and row 5 hides messages that originate from hosts matching the hostlist "vm-[0-9]".